Last time I introduced Vigilante : an open-source opinionated cluster management dashboard and automation service for Qdrant, built and open-sourced by the vector search team at AliExpress. I’ve talked about the reasoning behind its creation and set the stage for the feature-by-feature exploration of its capabilities. Let’s begin!
A vantage point
Vigilante dashboard is designed to give you immediate insight into cluster status. And the main question is this : is the cluster doing fine? The top of the dashboard is an at-a-glance readout that answers exactly that. The sections immediately below it drill down into the specific nodes that make up the cluster and the operations you can perform on each of them.
This article walks through that entire top half of the dashboard: the Cluster Status card, the Warnings panel, the Cluster Nodes grid with its per-node actions, and the cluster StatefulSet-level controls.
The Cluster Status
The Cluster Status card answers three questions:
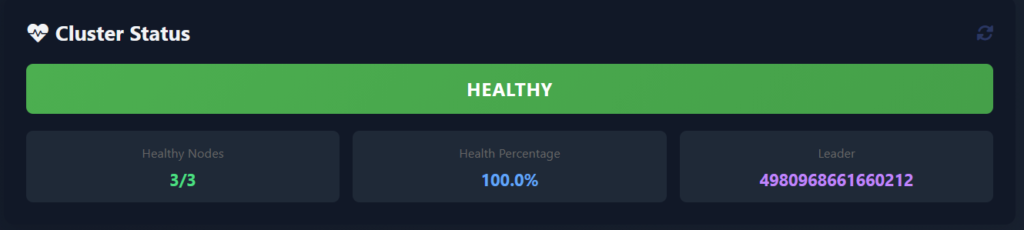
- What is the overall state of the cluster? HEALTHY (green), DEGRADED (yellow), or UNAVAILABLE (red). These labels are computed from the per-node health checks.
- How many nodes are alive? A “Healthy Nodes” tile shows the ratio, e.g.
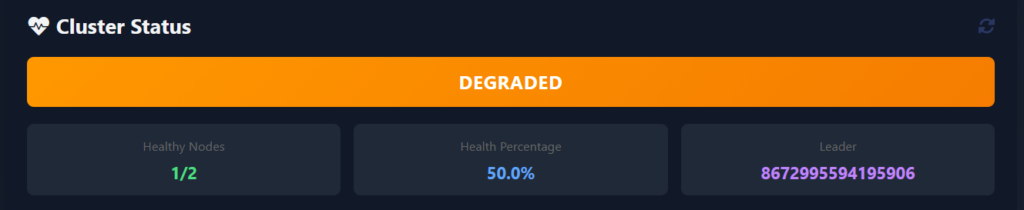
3/3when all nodes are reachable, or2/3the moment one of them stops responding. If the node is completely down we will observe something like1/2. - Who is the current Raft leader? A “Leader” tile shows the ID of the peer elected as a leader (e.g.,
8672995594195906). Immediately knowing the leader matters die to some of the operational decisions, like which pod to inspect first when something is off, depend on it. Qdrant itself reports this information through/clusterendpoint, but have to aggregate the results from all the cluster nodes to see the full picture. Vigilante does that for you.
A “Health Percentage” tile rounds out the row with a single-number summary (100.0% when everything is green). This metric degrades smoothly as nodes drop out rather than switching from OK to DOWN.
Behind the scenes, all of this is driven by the hosted background service inside the Vigilante process that runs on a configurable interval (By default 120 seconds. Adjustable at runtime, we’ll see how in Section 5). Each cycle, it fans out HTTP calls to every known Qdrant node, collects their cluster views, diffs them against each other, produces a unified ClusterState object that the dashboard then renders.
Healthy status will be shown as this
If we kill one of the pods the view will change to the following
Warning detection and issue tracking
“The cluster is degraded” tells you that something is wrong. Now the question is – what? Vigilante answers it through a dedicated Warnings and Issues panels that sit directly under the Cluster Status card.
If we return to the example when a node was killed, these panels will show all the problems each of the remaining cluster nodes had encountered.
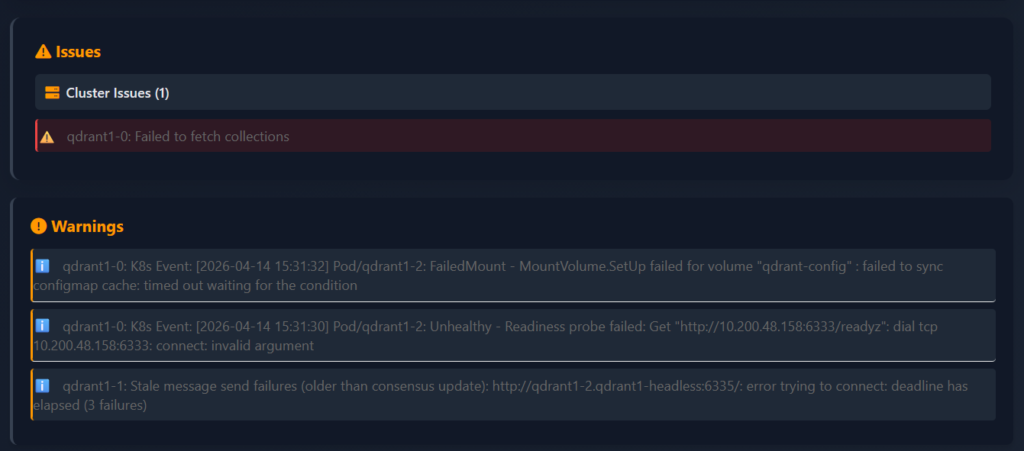
The panel only appears when there is actually something to warn about, which means an empty dashboard really is an empty problem list. When warnings are present, each one is shown with the affected node, a human-readable description and the underlying error message.
Vigilante knows how to detect some of the error types that can be encountered – or at lest those that we have actually encountered and reports them appropriately:
Timeout– a node is reachable but not responding within the configured HTTP timeout.ConnectionError– a node’s endpoint cannot be reached at all (pod down, network policy, DNS).CollectionsFetchError– the node is alive but cannot enumerate its own collections, usually a storage-layer problem.ConsensusThreadError– the node’s internal consensus thread is reporting errors, which is an early warning sign of a split-brain situation.MessageSendFailures– the node is repeatedly failing to send consensus messages to specific peers.ClusterSplit– Vigilante notices when different nodes report different views of the cluster topology, indicating that consensus has effectively forked, and now we are having several clusters instead of just one.
Cluster-split in some cases can be particularly tricky to catch manually or during the collection queries because each individual node looks fine from its own perspective – it’s only when you compare what every node sees between all nodes – you observe the inconsistency. Vigilante collects all those views in a single monitoring cycle and flags the divergence automatically.
Node overview
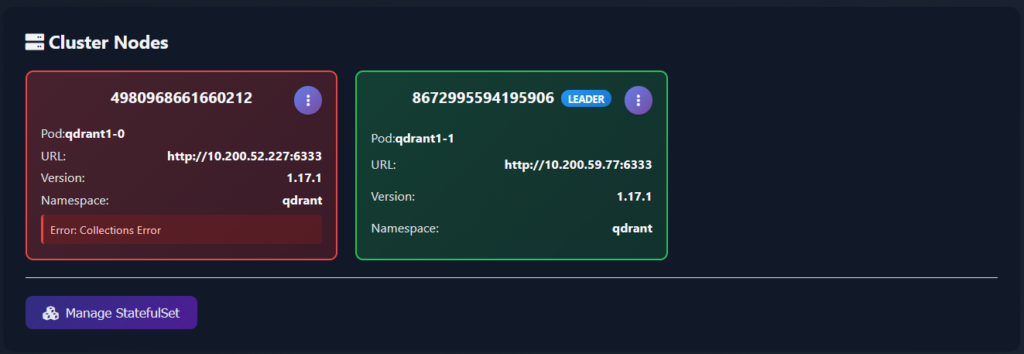
Below the cluster-level summary and Warnings and Issues panels, the Cluster Nodes section displays each individual node and a set of operations that can be performed on it. Nodes are rendered as a responsive grid of cards, one card per peer, with everything a human operator typically wants to see on a single pane:
- Peer ID – the numeric peer identifier used when issuing any cluster-related operations from the Console.
- Pod name – e.g.
qdrant1-0,qdrant1-1,qdrant1-2. This is the Kubernetes pod backing the peer and some operations require the pod name (logs, restarts, exec). - Peer URL – the cluster-internal address Vigilante uses to talk to the node. Handy when you need to confirm that service discovery is pointing where you think it is.
- Version – the Qdrant binary version running on that node. During the upgrades, having a side-by-side view of node versions makes it trivial to spot a pod that got stuck on an old image.
- Namespace – the k8s namespace, useful when you have multiple Qdrant clusters in the same k8s cluster.
The LEADER badge is pinned on the card of whichever node is currently the Raft leader.
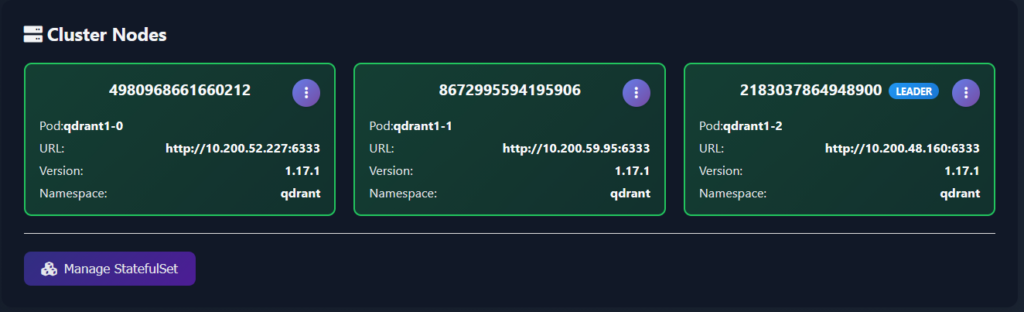
Card borders are colour-coded by health: green for a cleanly operating node, orange for a node with active warnings, red for a node that’s failing its health checks.
Node discovery is automatic. When Vigilante is running inside Kubernetes – it queries the Kubernetes API for pods in the namespace it is deployed to, matching a label selector app=qdrant and builds the node list from there. When running outside Kubernetes, Vigilante falls back to a QDRANT_NODES environment variable with a list of the nodes it should watch over (host:port;host:port;...). If those are not provided, it reads the explicit entries in the config file. That tiered discovery makes the same tool work both in a docker-compose scenario and in a real Kubernetes production deployment.
Per-node actions
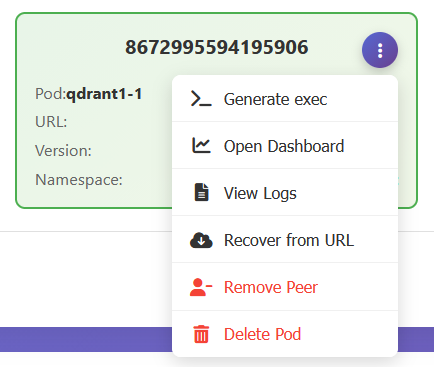
Each Qdrant cluster node card has an action menu in its top-right corner, and opening it exposes the available actions that cover essentially every ad-hoc thing you’d normally want to do against a specific node:
- Generate exec – produces a ready-to-paste
kubectl execcommand targeting the specific pod behind that node and copies it to the clipboard. Oddly enough, the first helper action ever built into Vigilante, and the usefulness of it fuelled the further development of the tool. It saves you from having to remember the namespace, the pod name, the container name, and the argument ordering, especially when you have more than one cluster. - Open Dashboard – opens the native Qdrant Dashboard for that specific node in a new tab. Vigilante deliberately doesn’t reimplement the per-node dashboard Qdrant already ships – instead, it allows for a one click jump into it when you need its capabilities. Of which there is a plethora and the list grows on with each release.
- View Logs – opens a slide-out side panel, streaming the logs of that node’s pod. Logs are paginated and return up to 1,000 entries per request. The log panel will be covered in more detail in a further article, but the point here is that the answer to the question “what does the node say?” have never been closer.
- Recover from URL – kicks off a collection recovery on the selected node, given a snapshot URL and a set of options. Useful when you’re rebuilding a drained node. Recovery will be covered in detail in the further article.
- Remove Peer – removes the node from the Qdrant cluster. Supports a force option for the case where the node is already dead and needs to be chopped off. Under the hood, this is calling Qdrant’s own peer-removal API, Vigilante just wraps it in a button and a confirmation dialogue.
- Delete Pod – deletes the underlying Kubernetes pod. If the Qdrant runs as a StatefulSet – which is usually does, the pod will be rescheduled automatically. Thus, this is effectively a “restart node” button.
It is worth noting that the exposure of both Qdrant cluster-level and a Kubernetes-level operations to the operator is deliberate. Removing a peer is an operation on Qdrant cluster, while deleting a pod is an operation on the k8s cluster. Having both in the same menu means you always know which one you’re actually doing.
StatefulSet management
While we are at the topic of k8s operations, let’s talk about scaling. Below the node grid, a dedicated Manage StatefulSet button covers the two k8s operations:
- Rollout restart – performs a rolling restart of the entire StatefulSet. Does what is says on the tin, provided the StatefulSet is correctly configured.
- Scale – changes the
replicasfield on the StatefulSet, letting you grow or shrink the cluster directly from the dashboard.
Both operations go through the Kubernetes API, so they respect the same StatefulSet ordering guarantees you’d get from kubectl rollout restart statefulset/... or kubectl scale. And they’re one click away from the cluster view that told you needed them in the first place, rather than a context switch away in a separate terminal.
The health monitoring and node management give you a tool set for a running logical Qdrant cluster as a whole: you can see exactly what’s happening, down to the level of individual nodes and specific error conditions, and you can act on what you see without ever leaving the dashboard.
Once you ensured that the cluster is alive and kicking, the next question naturally becomes: what’s happening to the data in the cluster? That’s what we’ll cover next.
See you in a next one!
Next: Collection management and shard operations