Last time we talked about setting up, managing, and troubleshooting our own self-hosted Qdrant cluster. At the very end I introduced to you the tool that was developed along the way. The tool that we use every day to monitor, manage, and generally make sense of what is happening with our collections and nodes.
I take a moment and remind you that all the following applies only to the self-hosted deployment model that the Qdrant OSS project provides. We don’t use Qdrant Cloud, although I am confident that the problems that I’m about to discuss are all solved there. I will also use the concepts of peer and node interchangeably during the course of this article, so beware.
Raison d’être
Retrieval-augmented generation, semantic search, recommendation systems, deduplication pipelines, anomaly detection, agentic workflows – almost every team that touches modern ML now has at least one vector store somewhere in the stack. Qdrant has become one of the most popular choices for that job: it is fast, has a clean HTTP and gRPC API, supports distributed deployments out of the box, and is comfortable running in Kubernetes.
But “comfortable running in Kubernetes” is not the same as “easy to operate at scale”. The moment a Qdrant deployment grows beyond a single node – the moment it becomes a real cluster serving real traffic – a new class of problems starts to appear, and some of them are problems that Qdrant itself is not designed to solve for you. It has all the required handles and knobs and gives you building blocks – sure – but how to apply them and in which order is entirely up to you.
The operational reality of running a Qdrant cluster
So you’ve successfully deployed Qdrant to your cluster, configured the database, created the collections and loaded them with points. For more insights on how we have solved this, I refer you to my previous article it this series.
Now, when live traffic rushed through to your DB, you have the real SLAs – whatever they might be. Consider what an on-call engineer actually has to deal with once a multi-node Qdrant cluster is in production:
- Is the cluster healthy right now? I.e. does it actually has the expected number of nodes? Qdrant exposes a per-node
/clusterendpoint, but the result may depend on which node answers the call. Some nodes may have fallen out of the cluster and are now living in their own cluster. You might have messed up with deployment settings, someone might have killed the nodes. Aggregating all that across nodes, detecting cluster splits (when nodes disagree on who is in the cluster), and distinguishing a timeout from a genuine consensus failure is left for the operator. - Which node is the Raft leader? Are consensus messages flowing? Qdrant reports this through the same
/clusterendpoint, but finding it out means shelling into pods or using the Qdrant Dashboard and grepping the logs – again on a per-node basis. - Are my collections actually replicated the way I think they are? After a node restart or a collection restore, some shard replicas may be in
GreyorRedstatuses. Restoring them requires manually issuing shard-transfer API calls from a terminal or a Qdrant Dashboard. This is actually the problem that is mostly solved by addition of a#clusterpage to the Dashboard. But there are sometimes more actions that need to be applied to restore the cluster to its initial state – as you will see shortly. - When was my last good backup? Qdrant supports snapshots, but it has no built-in concept of a schedule, retention policy, or a convenient mechanism of applying snapshots to the collection as a whole – not on a per-node basis. You either wire up cron jobs and external logic, or you don’t have reliable backups.
- How do I do a blue-green deployment of a collection, and once I’ve done it, how do I undo? Qdrant supports collection aliases, which is the right tool for the job, Dashboard displays them but quickly switching the alias is still a job for the console. At least it was until the capability was added to the Dashboard.
- A pod is misbehaving – how do I restart it? How do I drain the pod of all collections, and pull it out of the cluster for maintenance? Now you’re context-switching between
kubectl, the Dashboard and Console as well as flickering through the (bloody brilliant!) documentation pages. All that whilst trying your best to not mix the peer and shard IDs up accidentally removing the wrong node from the cluster, rendering the whole collection unstable or unusable. - What are the actual collection sizes on disk? The metrics reported by Qdrant were improving dramatically through two past releases :
1.16 and1.17, but there is still no metric that will tell you exactly how much disk space each collection occupies. But there now are a couple of metrics which allow you to do an interesting comparison trick I will show you later on. - What is overall cluster state from a bird’s-eye view? Are all the collections green, and if not – why? Are all the shards healthy, and are there any shard transfers currently running? The Dashboard provides per-collection info as well as some per-cluster numbers and states, but it does not aggregate all the (opinionated) vital information under one convenient page. So again you end up clicking through various Dashboard pages and views, accidentally issuing some Console commands.
Do you remember that we are on-call? So add the potential stress to the mix and shake, not stir.
None of the above is unique to Qdrant – every distributed database system has the same shape of problem. What is unique is that the management and maintenance ecosystem around Qdrant is still young. There are plenty of AI tools that integrate it, but there are no tools that assist in managing the cluster. There is a nice Dashboard shipped inside each Qdrant binary, therefore present on each node pod (which you need to find IP for after each redeployment), and there are well-documented HTTP endpoints, but there is no mature, cluster-aware control plane the way there is for, say, Kafka (Cruise Control, AKHQ) or Elasticsearch (Kibana’s stack management, Cerebro). Since we are on this boat from 1.6.0, we were bodging together scripts, aliases, curls and building some management capabilities as endpoints in our end-user services (yuck!).
It’s essential to reiterate that all the abovementioned problems are solvable by the tooling that Qdrant provides but in a Unix way : we give you the tools that work well each on their own, you build on top. Or, as once was written, we give you the plumbing you build the --porcelain. I, personally, prefer something more epic than the water closet analogy. Enter Vigilante!
Enter Vigilante
Vigilante is an open-source opinionated cluster management dashboard and automation service for Qdrant, built and open-sourced by the vector search team at AliExpress. The lead developer for the tool lives in Spain hence the name, but at the same time the tool is self-appointed and aggressive… well, you get the pun. It fills exactly the gap described above: a single web UI, backed by a small service running in your Kubernetes cluster as a sidecar to Qdrant nodes, that gives you a unified, cluster-wide view of Qdrant and the operational controls to act on what you see.
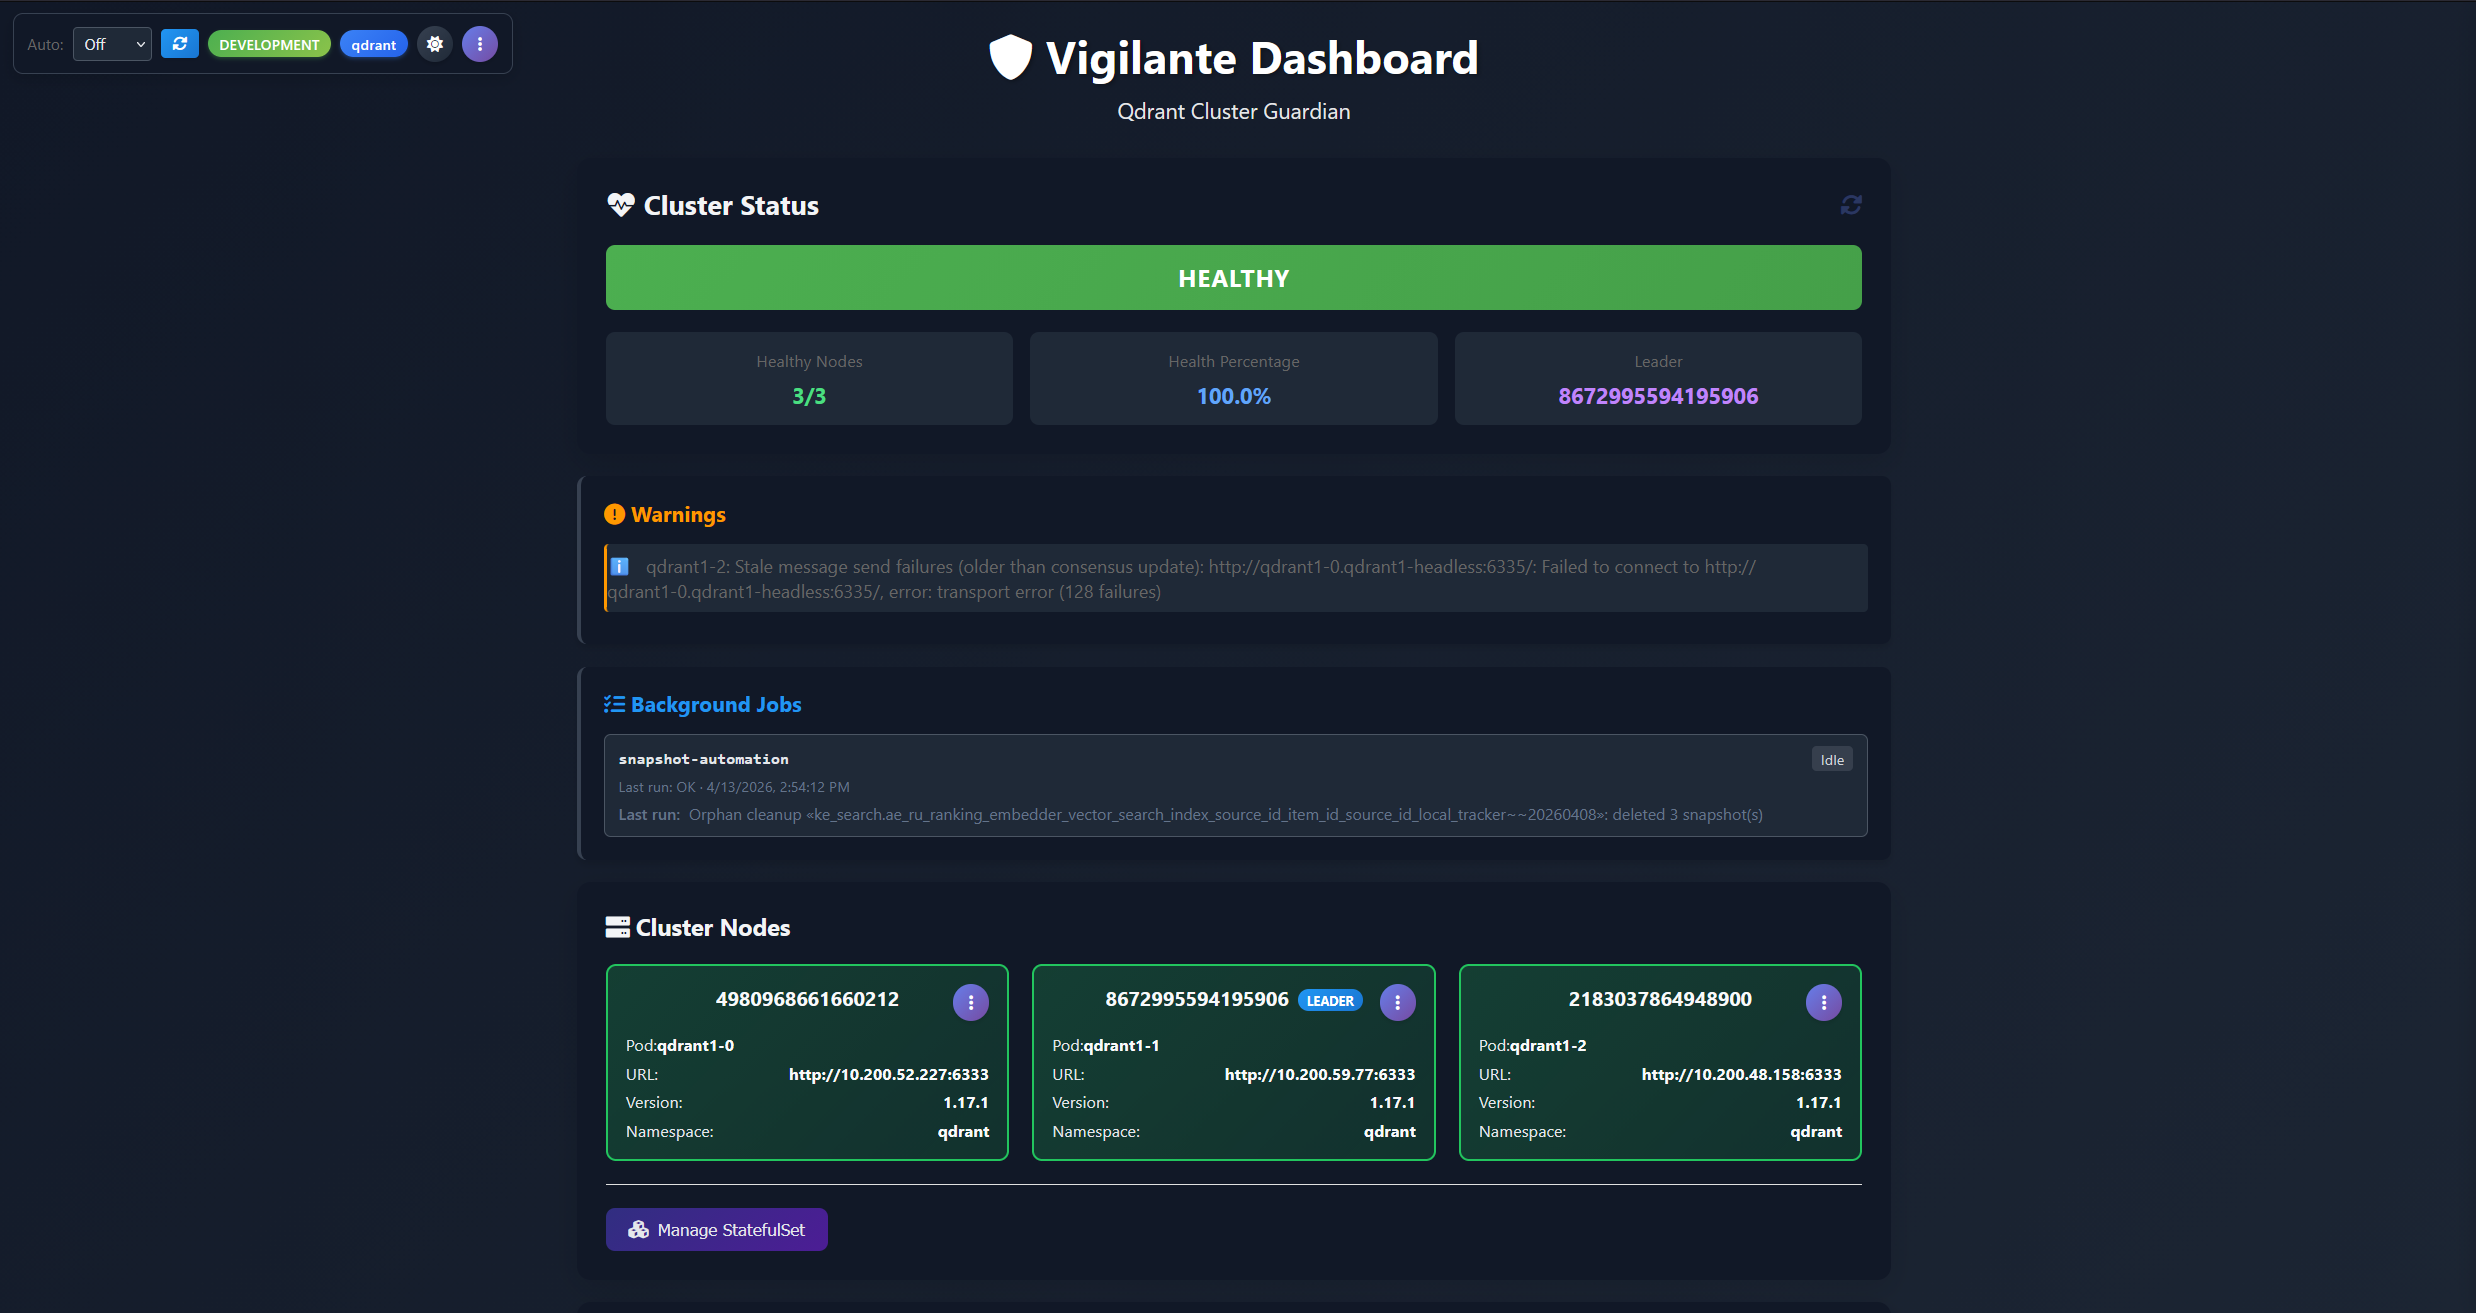
Vigilante is the “missing ops layer” for Qdrant. Instead of Dashboard + kubectl exec + curl + a docs page, you open one URL and get:
- A live, colour-coded health view of every node in the cluster, with specific, named warnings when something is wrong (including cluster-split detection or any other similar issues).
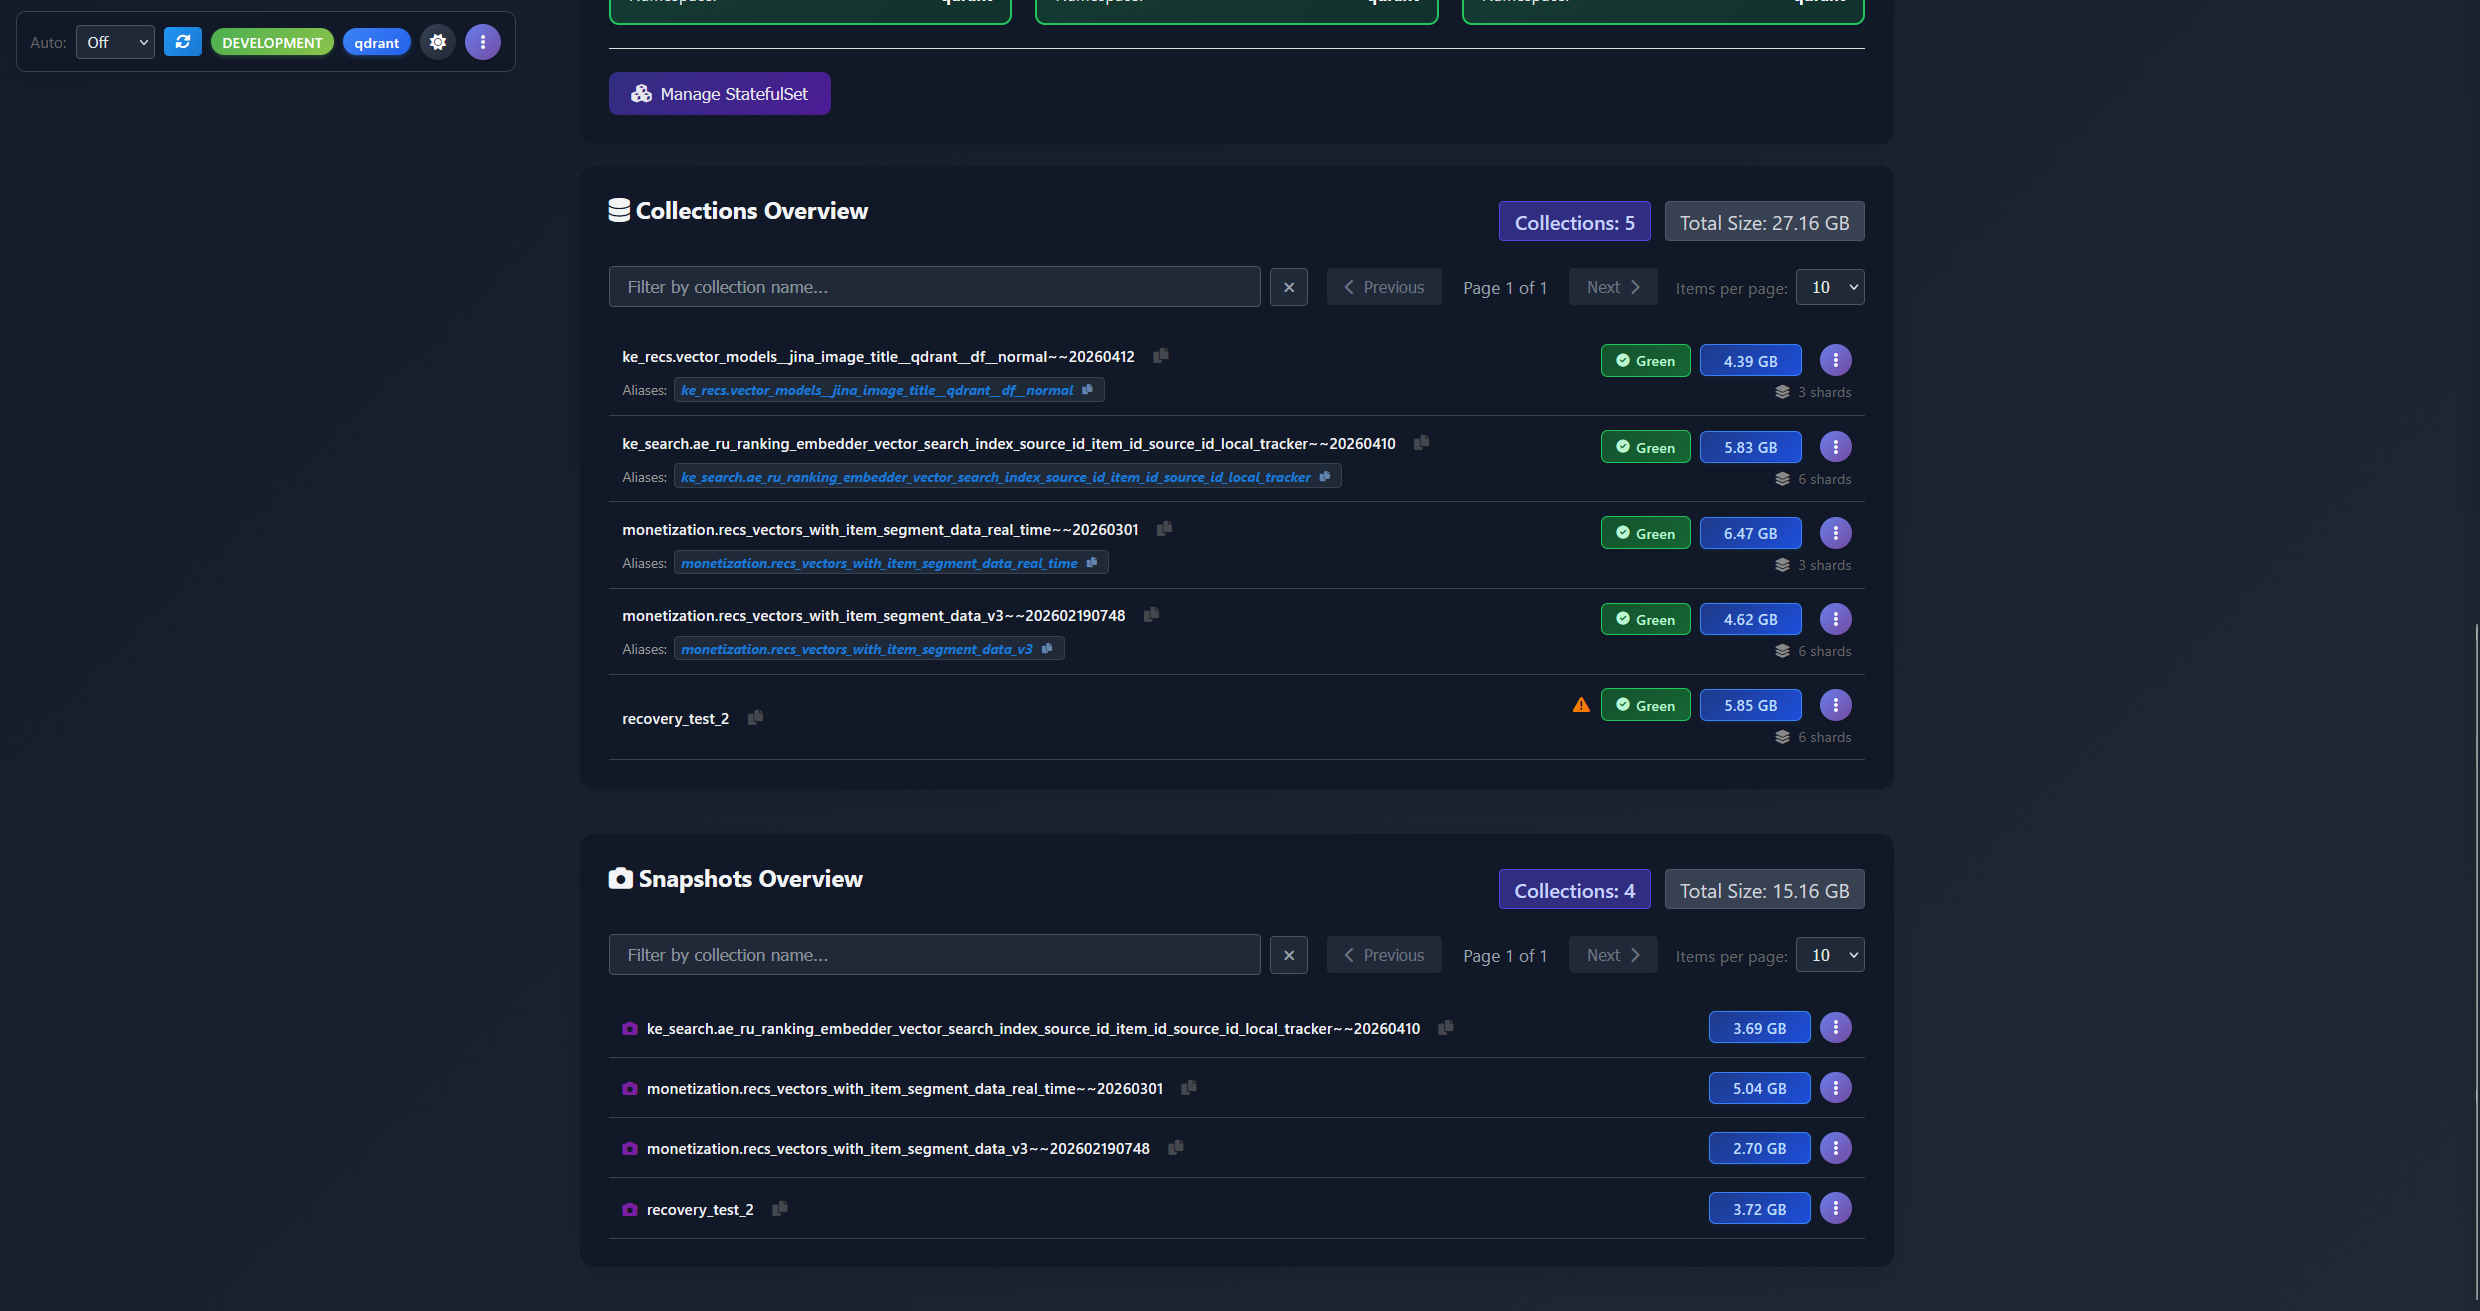
- A collection and snapshot browser that aggregates collection state across all nodes and all backends and storages (Qdrant API, S3, disk) into a single searchable list.
- A fully automated snapshot scheduler with retention, S3 storage integration, per-collection overrides, and automatic clean-up of orphaned snapshots – the ones that no longer have a collection they were created for. The backup system that Qdrant itself doesn’t ship.
- One-click per-shard operations for the things you’d otherwise run from a terminal: rolling restart a Qdrant cluster stateful set, drain and remove a peer from cluster, drop, create or move shard replicas, kick off a replication factor restoration, trigger a snapshot creation, recover a collection from a snapshot URL. Deleting from disk, circumventing the API, was a saviour in several cases when collection was causing Qdrant to panic!
- A log panel for Qdrant pods and for Vigilante itself, without leaving the dashboard.
Under the hood
The backend is an ASP.NET Core service on .NET 10, the frontend is a single-page application written in plain vanilla JavaScript – no React, no build step, no npm graph to audit, served as static assets. State changes are applied via the Qdrant HTTP API (using the Aerx.QdrantClient.Http client library I was writing about in the previous part of the series), the Kubernetes API (via the official KubernetesClient), and AWS SDK S3 for snapshot storage management.
In production, Vigilante runs as a small Deployment inside the same Kubernetes cluster as Qdrant, discovering Qdrant nodes automatically via pod labels and using an RBAC-scoped ServiceAccount to perform pod- and StatefulSet-level operations. For local development, a Docker Compose file in the repo brings up a three-node Qdrant cluster with Vigilante pre-wired, so you can try the whole thing end-to-end in a few minutes.
Blimey, that introduction ended up being far longer than I anticipated. Let’s split the feature by feature overview into separate articles, shall we? So you can start wherever you like, or just binge-read them one by one. So in the next chapters you will see:
- Cluster-wide health monitoring and cluster node management
- Collection management and shard operations
- Snapshot management and automation
- Conclusion
See you in a bit!
Next: Cluster-wide health monitoring and cluster node management.