Once you ensured that the cluster is alive and kicking, the next question naturally becomes: what’s happening to the data in the cluster? The Collections Overview section of the Vigilante dashboard gives you the tools to act on the answer. After all most day-to-day work ends up being scoped to a specific collection rather than the cluster as a whole.
The Collections Overview is what you see immediately below the Cluster Nodes grid. Under the hood it pulls from GET /api/v1/collections/info, which aggregates collection information across every healthy node into a single unified list. Let’s talk about what happens when you click into a specific collection, and especially the batch shard and replication operations.
Where’s All the Data
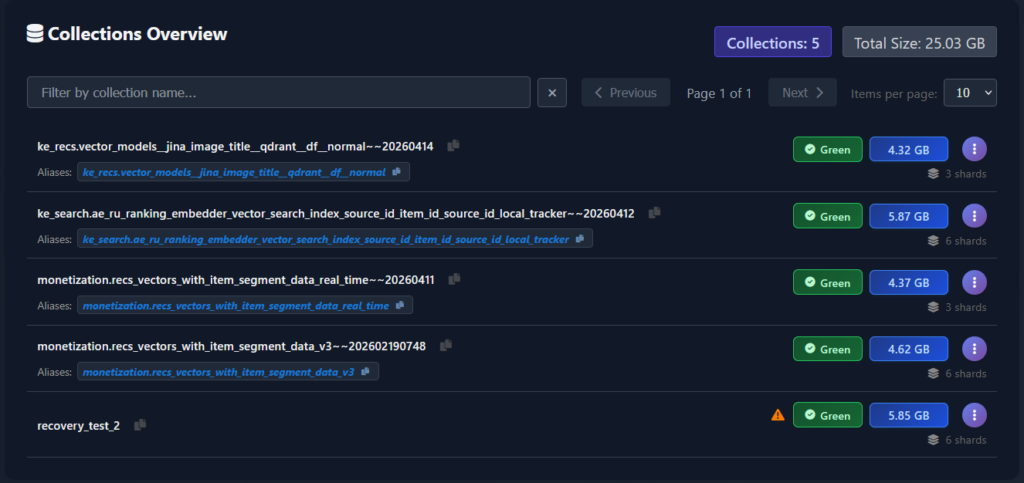
The Collections Overview panel is a paginated, searchable table with one row per collection. Each row tells you, in a single glance:
- Collection name – obviously the collection name. Since the collection name can be very long and dodgy to copy from UI, so a small copy-to-clipboard icon sits next to the name so you can paste it into a command.
- Aliases – if the collection has aliases pointing at it, they’re rendered inline directly beneath the name. Frankly, idea stolen from Dashboard, and it’s one of the few things that actually duplicate the Dashboard functionality. Same copy-to-clipboard button for symmetry and convenience.
- Optimization status – a coloured badge showing the collection’s optimizer state. Direct mapping from collection status.
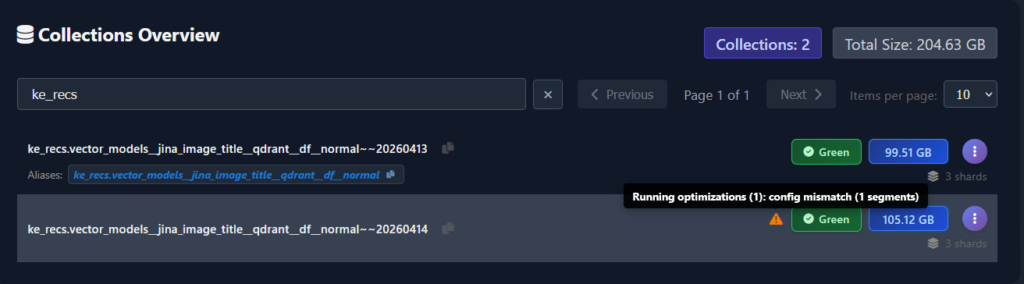
- Warning icon – an amber triangle next to the collection name appears when the collection has replication or optimization problems, or – the most common case – the collection reports Green status, but some optimizations are still running on the collection. Hovering reveals the specific warning.
- Size in GB – the total on-disk size of the collection, summed across all its shards. This one was the tricky one since when it was added, Qdrant did not report the collection sizes. It still does not report the full size of the collection exactly how it is on disk, that’s why we are getting this info from each pod’s OS. This is the number you want when you’re reasoning about backup volume and storage capacity.
- Shard count – the number of logical shards the collection is split into.
Above the collections table, two summary chips give you the totals at a glance: the total number of currently visible collections in the cluster and their combined size. They are always consistent with the rows you’re looking at : if you filter only some collection names, the values will change accordingly.
Speaking of filtering: the table has a search box that filters by collection name prefix, a page-size selector, and paginated navigation controls. Production Qdrant clusters can end up with several dozen of collections – though high collection count is discouraged by documentation – and many of the names may start with some team prefixes or other designators. Typing a prefix is by far the fastest way to find the collections you want to inspect. Works only on collection names, does not work by aliases. And does not have fuzzy search — yet.
Collection details – per-node and per-shard
The Collections Overview table is the summary view. Vigilante expands an in-place drill-down beneath the row, showing exactly how that collection is laid out across the cluster.
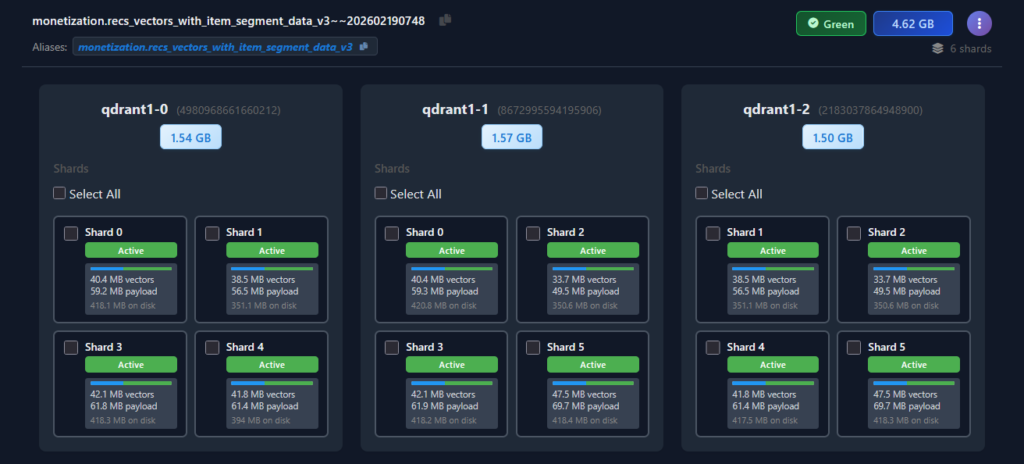
The expanded view is arranged as one card per cluster node, side by side. Each node card carries the pod name, the peer ID next to it, and a size at the top showing how much of the collection is physically stored on that node. Because Qdrant distributes shards across peers, the per-node sizes don’t always divide evenly – at a glance, this view tells you whether a collection is balanced across the cluster or whether one node is carrying disproportionately more data than the others.
Below the size chip, each node card lays out a grid of shard cards, one per shard replica hosted on that node. The grid makes the replication topology obvious.
Each individual shard card shows everything you’d want to know about that specific replica:
- Shard number – corresponding to Qdrant internal shard identifiers.
- Status badge –
Active(green) when the shard is serving traffic and in a healthy state. Other states surface here too when applicable: in recovery, initialization, dead, etc. - Size breakdown – vector data size, payload data size. These are reported by Qdrant 1.17 telemetry. And total on-disk size this one is extracted from pod OS. This breakdown also features a progress bar showing the relative sizes of vector (blue) \ payload (green) data. This one is useful when reasoning about how much more RAM the collection will occupy if we hoist a payload to RAM.
- Selection checkbox – in the top-left corner of the card. This is where the drill-down view stops being read-only and becomes actionable. We will see what it does shortly.
Before Vigilante and some recent Dashboard updates, the collection topology reasoning workflow was all about issuing many Console commands and reading a bunch of JSON outputs. With Vigilante, it’s just a click away.
Act responsibly
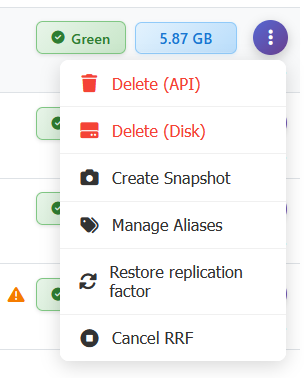
Every row in the Collections Overview has an action menu on the right edge that exposes the everyday-operations surface for a collection. Without Vigilante, some are simply aliases for Console request, some require switching between Qdrant peers, and some are downright impossible.
- Delete (API) – deletes the collection through the Qdrant HTTP API. This is the ordinary collection deletion path.
- Delete (Disk) – the extraordinary path. This deletes the collection’s files directly from the pod’s storage, bypassing the Qdrant API. You only ever want this for corrupted collections that Qdrant itself refuses to delete – typically when cluster is in some boggled up state.
- Create Snapshot – triggers a manual snapshot creation for the collection across all healthy cluster nodes. Snapshots are covered in detail in further article. For now, it’s enough to know that snapshot creation just a click away from the collection row.
- Manage Aliases – opens a dialogue for creating, renaming, or deleting aliases pointing to this collection.
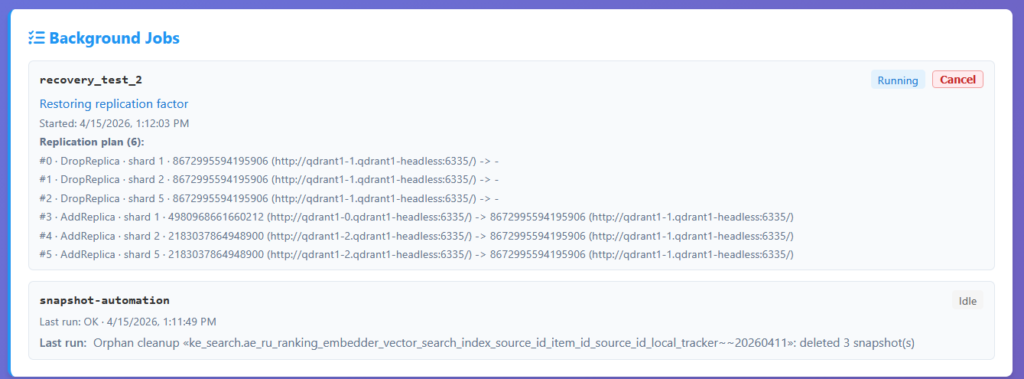
- Restore replication factor – this one is rather special. Our .NET driver has a concept of a compound operation. One method call that internally does multiple things. This is one of those operations. It is useful when you – for any reason – have an unbalanced collection. Meaning that collection shards are not equally distributed between peers, some replicas are dead, or some shards are replicated more times than needed. Basically, it’s “repair what I’ve done” button. It kicks off a background job that walks the collection’s shards on all peers and restores the configured replication factor by copying shards to peers that are missing them, removing extra or dead shard replicas and moving replicas around, so the collection distribution is nice and even. This is the thing you want after say collection recovery failure: rather than manually issuing shard-replication calls, you click one button and a tracked, progress-reported background job takes care of bringing the collection back to full redundancy. The job shows up in the Background Jobs panel (see further article for more details!), with progress messages and an optional cancel button.
- Cancel RRF – cancels the in-progress Restore Replication Factor job for this collection. This one is here to pair it up with previous operation, so that if you kicked off a restore and then realized it was going to interfere with something else, you can stop it cleanly.
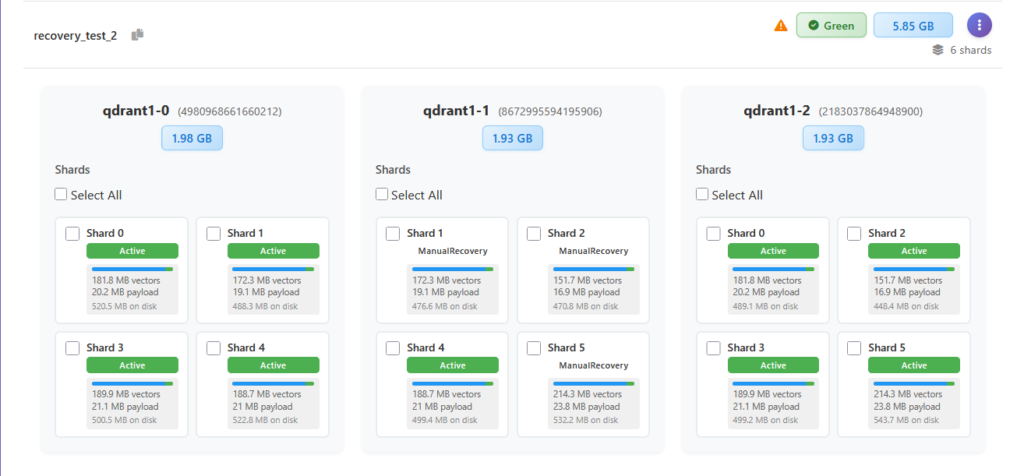
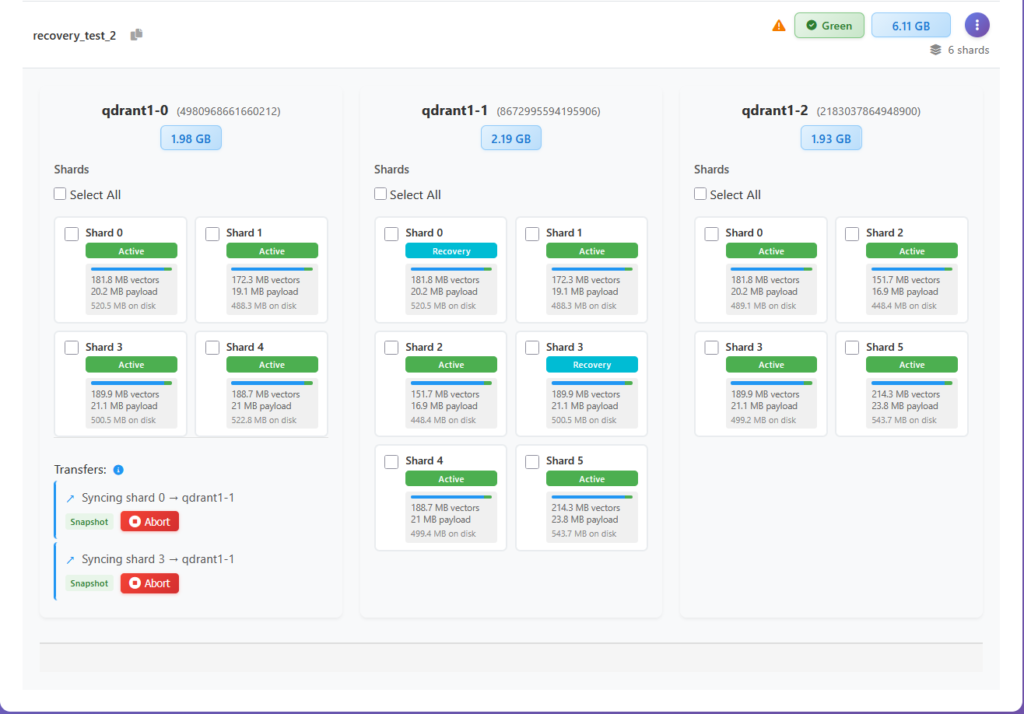
Restore replication factor example. The collection recovery_test_2 has some nodes stuck in ManualRecovery state.
Let’s click on RRF and see what happens. First we see the replication plan – a set of replication actions that will be applied across collection shards.
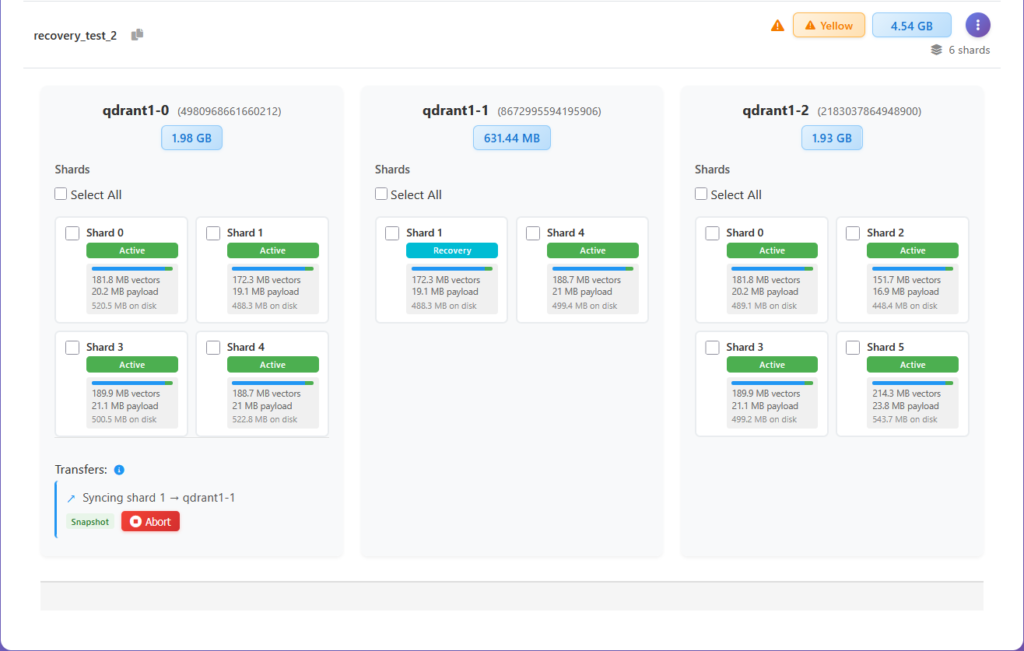
Next we see these actions applied one by one.
Until collection is perfectly balanced.
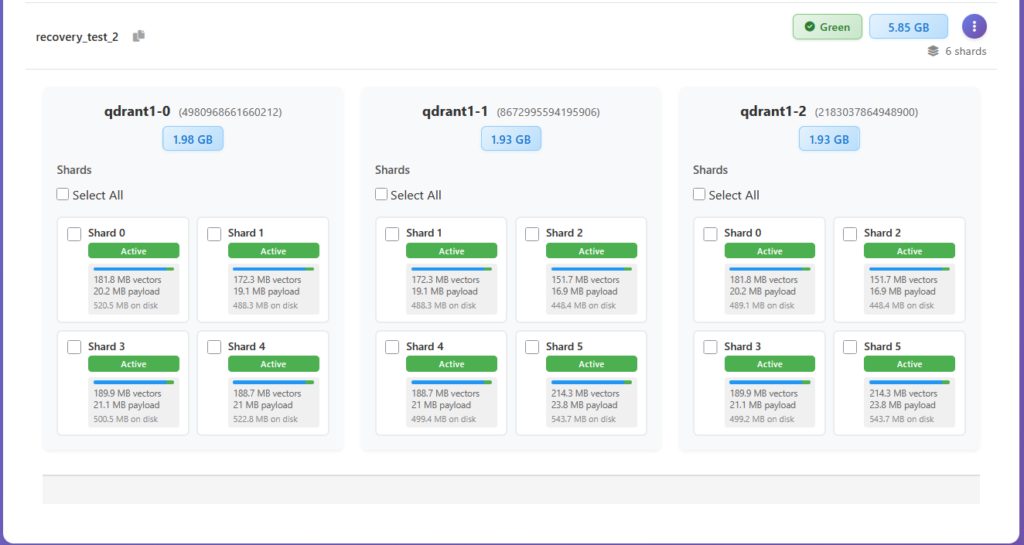
I love magic!
Cluster topology control
We have just seen how automatic shard replication operations are executed by Vigilante. But it also gives you complete creative control over all collection shard movements – and in batches too! Think Dashboard but on steroids. Vigilante exposes the full set of shard-level operations that Qdrant supports, at the per-collection scope.
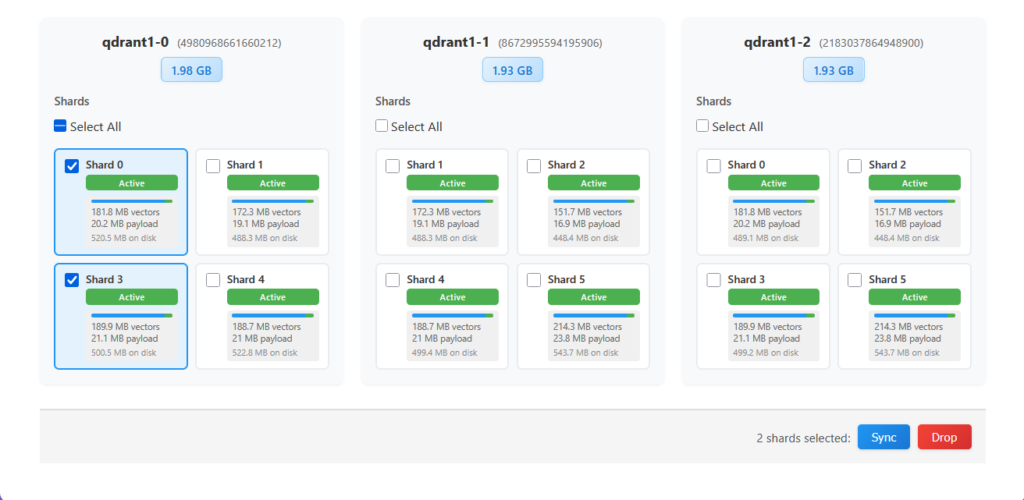
The checkboxes tie into an action bar that appears at the bottom of the expanded view the moment you select at least one shard. The bar is simple: on the left, a count of selected shards, and on the right, two buttons: a blue Sync and a red Drop. Selection works across the node card in the expanded view – you can select any shards on one node to queue them for sync or deletion, letting you act on any arbitrary shard subset in a single operation. Each node card also has a Select All checkbox at the top of its shard grid that selects every shard on that particular node – useful when draining peer one collection at a time.
The two available actions are:
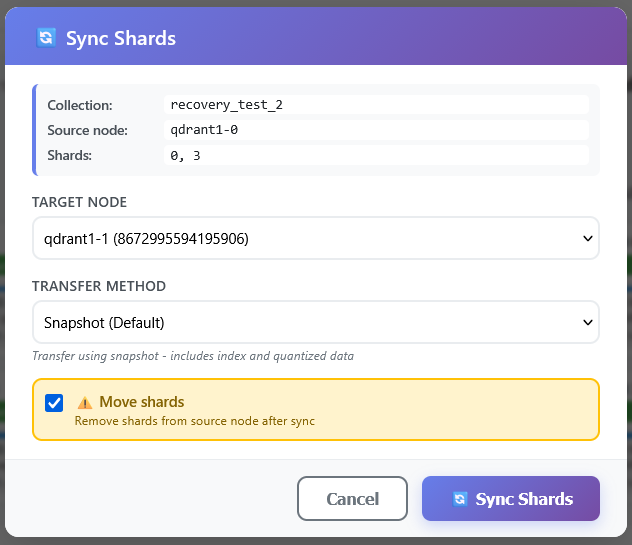
- Sync – replicate the selected shards to a selected target peer. You can choose the replication mode and opt in to move the shards, i.e. to delete them from a source peer after the replication to the target is complete.
- Drop – remove the selected shard replicas from the peer they are currently on. Used when you’re draining a peer, shedding load, or cleaning up a replica you no longer want.
Before Vigilante, the equivalent manual shard balancing workflow was: open a Console, list shard distribution, visually parse the JSON, identify the shard you want to move, pick peer IDs, assemble another Console command parameters, trying not to mess up the peer and shard IDs, issue a command and poll the Console for transfer completion. In the worst-case scenario – repeat that for every shard you would like to move around. Here it’s: click the collection name, tick the checkboxes on the shards you care about, click Sync. The operation issued internally by the Vigilante is the same set of Qdrant API calls, the difference is how many chances you get to select a wrong a peer ID or a shard number on the way there.
There are a few things worth saying about the shard and collection set of operations collectively. First, they all exist in Qdrant’s own API. What Vigilante adds is surfacing them in a UI where the inputs (peer IDs, shard IDs, source/destination) are autopopulated from the current cluster state rather than hand-typed (even with the help of autocompletion Console provides).
Second, the fact that these operations are accessible from the same UI that just told you “this node is unhealthy” closes the loop over a single tool: you see the problem, and you have the means to fix it in the same view.
Third, the more complex workflows (restore replication factor, shard moves) are implemented as single click actions with visual status feedback, not a bunch of manual API calls, which means you get a real progress surface rather than having to poll the cluster yourself to find out when the work actually finished.
Between the views of what collection you have, how you manage them, and how the collection shards and their contents are physically distributed, this article covers essentially the full data-plane of a Qdrant cluster. The last piece of a puzzle is how do we make sure that we always have a backup if things go terribly wrong? In other words : how do we build atop an existing Qdrant snapshot system. And that’s the topic for the next time.
Stay tuned!
Next: Snapshot Management – Backups Done Right.